What Does a Typical Data Warehouse Solution Architecture Look Like?
Warning: This article was written from the Google Cloud perspective; otherwise, concepts are the same irrespective of cloud, whether it is AWS or Azure or GCP.
TL;DR
BigQuery acts as a staging area for data analytics workloads, allowing various users within an organisation, including analysts and data scientists, to gain insights from the processed data.
Four challenges when dealing with data
When dealing with any data, you will face four challenges.
- Variety
- Volume
- Velocity
- Veracity
In modern organisations, the data can be in any format (variety), any size (volume), any speed (velocity), and possibly inaccurate (veracity).
| Data | Challenge |
|---|---|
| variety | any format |
| volume | any size |
| velocity | any speed |
| veracity | inaccurate |
Data warehouse architecture
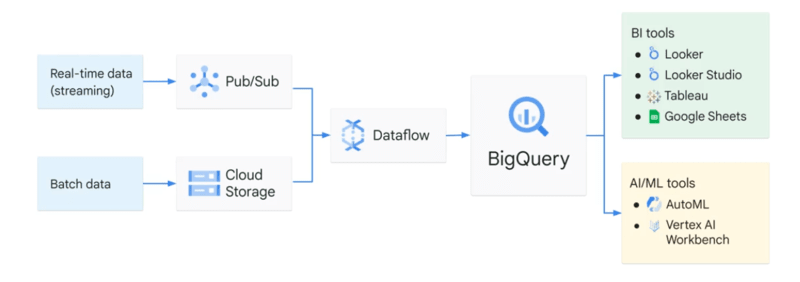
The input data can be either real-time or batch data.

🔥 Real-time:
If it's streaming data, which can be either structured or unstructured, high speed, and large volume, Pub/Sub is needed to digest the data.
Real-time data (streaming) => Pub/Sub => Dataflow => BigQuery => BI tools or AI/ML tools

❄️ Batch data:
If it's batch data, it can be directly uploaded to Cloud Storage.
Batch data => Cloud storage => Dataflow => BigQuery => BI tools or AI/ML tools

After that, both pipelines lead to Dataflow to process the data. That's where we ETL – extract, transform, and load the data if needed. Common SQL patterns like Gaps and Islands are often used during the transformation phase to identify consecutive sequences or detect missing data.
BigQuery sits in the middle to link data processes using Dataflow and data access through analytics, AI, and ML tools.
The job of the analytics engine of BigQuery at the end of a data pipeline is to ingest all the processed data after ETL, store and analyse it, and possibly output it for further use, such as data visualization and machine learning.
BigQuery outputs
BigQuery outputs usually feed into two buckets:
- Business intelligence tools
- AI/ML tools
BI tools:
- Looker
- Looker Studio
- Tableau
- Google Sheet
AI/ML tools:
- AutoML
- Vertex AI Workbench
If you're a business analyst or data analyst, you can connect to visualization tools like Looker, Looker Studio, Tableau, or other BI tools.
If you prefer to work in spreadsheets, you can query both small and large BigQuery datasets directly from Google Sheets and perform common operations like pivot tables.
Alternatively, if you're a data scientist or machine learning engineer, you can directly call the data from BigQuery through AutoML or Workbench. These AI/ML tools are part of Vertex AI, Google's unified ML platform. For a practical guide on building ML models directly in BigQuery, see BigQuery ML Models which covers the available model types and their use cases.
BigQuery is like a common staging area for data analytics workloads. When your data is there, business analysts, BI developers, data scientists, and machine learning engineers can be granted access to your data for their own insights.
Summary
This article discussed the challenges of dealing with data in cloud computing platforms and focused on the Google Cloud perspective. It identifies four main challenges: variety, volume, velocity, and veracity.
The article then illustrated how Google Cloud components and tools like Pub/Sub, Cloud Storage, Dataflow, and BigQuery can be used to handle these challenges. It highlights that BigQuery serves as a central data analytics engine, connecting data processes and providing access to the processed data for analytics and AI/ML tools.
The outputs from BigQuery can be used by business intelligence tools or AI/ML tools, catering to the needs of business analysts, data analysts, data scientists, and machine learning engineers. For more perspectives on data engineering decisions, visit Insights.
Post Tags: